This is not a real question, we know that yes, unfortunately, they did. There are over one thousand confirmed cases. But a recent preprint, posits that over 40,000 and maybe as many as 80,000 people did.
The preprint is COVID-19 Antibody Seroprevalence in Santa Clara County, California by Bendavid et al., MedArxiv, 2020 https://doi.org/10.1101/2020.04.14.20062463
The preprint is not very informative on methods, but, it seems to me, that, if this was the only evidence we had about Santa Clara County, it would barely be enough, according to the traditional standards of scientific evidence, for the authors to claim that anyone in Santa Clara got infected. In any case, the prevalence reported is likely an over estimate.
The evidence
The authors tested 3,330 individuals using a serological (antibody) test and obtained 50 positive results (98.5% tested negative, 1.5% tested positive).
This test was validated by testing on 401 samples from individuals who were known to not have had covid19. Of these 401 known negatives, the test returned positive for 2 of them. The test was also performed on 197 known positive samples, and returned positive for 178 of them.
There are some further adjustments to the results to match demographics, but they are not relevant here.
The null hypothesis
The null hypothesis is that none of the 3,330 individuals had ever come into contact with covid19 and had no antibodies.
Does the evidence reject the null hypothesis?
Maybe, but it’s not so clear and we need to bring in the big guns to get that result. In any case, the estimate of 1.5% is almost certainly an over-estimate.
Naïve version
- Let’s estimate the specificity: the point estimate is 99.5% (399/401), but with a confidence interval of [98.3-99.9%]
- With the point estimate of 99.5%, then the the p-value of having at least one infection is a healthy 2·10⁻¹¹
- However, if the confidence interval is [98.3-99.9%], we should perhaps assume a worst-case. If specificity is 98.3% then the number of positive tests is actually slightly lower than expected (we expected 57 just by chance!). Only if the specificity is above 98.7% do we get some evidence that there may have been at least one infected person.
With this naive approach, the authors have not shown that they were able to detect any infection.
Semi-Bayesian approach
A more complex model samples over the possible values of the specificity
- If the specificity is modeled as a random variable, then we have observed 2 positives out of 401 in known cases.
- So, we can set a posterior for it of Beta(402, 3) (assuming the classical Beta(1,1) prior).
- Let’s now simulate 3330 tests, assuming they are all negative, with the given specificity.
- If we repeat this many times, then, about 7% of the times, we get 50 or more false positives! So, p-value=0.07. As the olds say, trending towards significance.
Still no evidence for any infections in Santa Clara County.
Full-Bayesian
Finally, the big guns get the right result (we actually know that there are infections in Santa Clara County).
We now do a full Bayesian model
- We model the specificity as above (with a prior Beta(1,1)), but keep also model the true prevalence as another Bayesian variable.
- Now, we have some true positives in the set, given by the prevalence.
- We model the sensitivity in the same way that we had modeled the specificity already, as a random variable constrained by observed data.
- We know that the true + false positives equals 50.
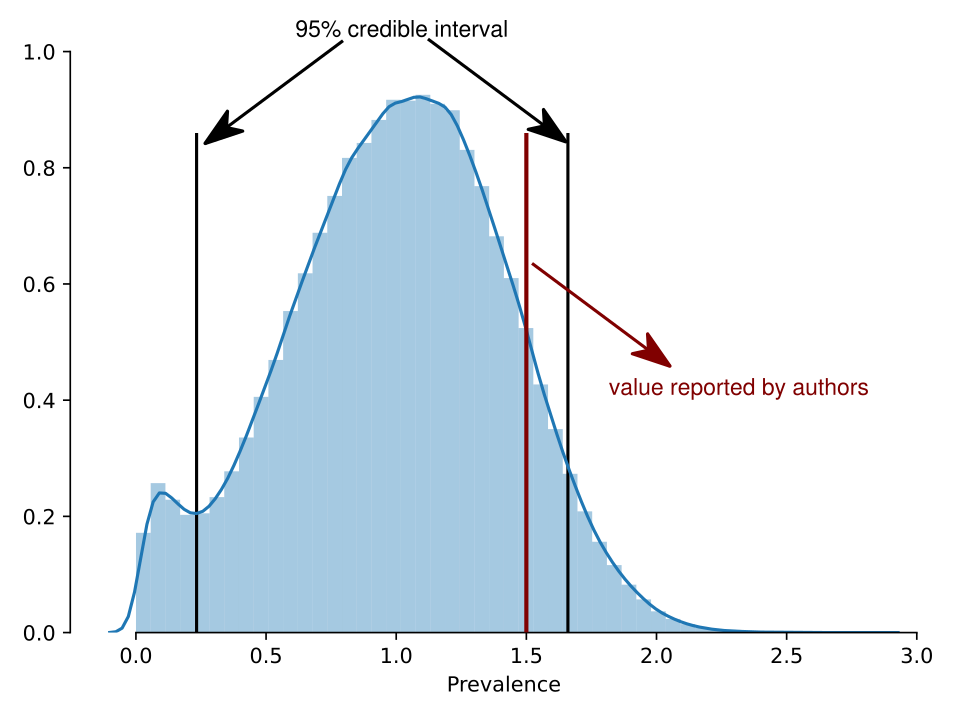
Now the prevalence credible interval is (0.4-1.7%). It is not credible that there are zero individuals who are positives anymore. The credible interval for the number of positives in the set is (15-51).
The posterior distribution for the prevalence is the following:
In this post, I did not even consider the fact that the sampling was heavily biased (it is: the authors recruited through Facebook, it can hardly be expected that people who are looking to get tested would not be enriched for those who suspect were sick).
In the end, I conclude that there is evidence that the prevalence is greater than zero, but likely not as large as the authors claim.
PS: Code is at https://gist.github.com/luispedro/bbacfa6928dd3f142aba64bfa4bd3334

Excellent. You didn’t even have to get into the cross-reactivity issue on the type of test being used. Some people can have some immunity (antibodies) from other coronavirus species (common cold) with a few % immune but this has no significant impact on the pandemic path.
Why not use the Jeffrey’s Beta(0,0) prior? That is by far what I would regard as the default prior. I doubt it changes much.
Really appreciate someone doing this — the uncertainty on the specificity pieces of the model is important.
I cannot do MCMC with Beta(0,0), but I can do Beta(0.5, 0.5) which is also widely used: the results are basically the same, except that the semi-Bayesian model becomes significant (p=0.03)—Beta(1,1) is kind of saying that we’ve seen 1 positive and 1 negative example already, which means we end up with 3 false positives, while Beta(0,0) is only 2 false positives (very hand wavey, but kind of right)
This can be solved numerically as well, so we could solve Beta(0,0) that way. See https://twitter.com/NimwegenLab/status/1251261264690634753 and subsequent discussion (Nimwegen is using Beta(1,1))
Thats reasonable. I was just thinking about the 0,0 for the sensitivity/specificity priors, where you get a clean posterior, but I guess you would want to do it for the prevalence, and then it would get nasty. Thanks for the reply.
Notice that using the same crude method in the paper (assuming the measured infections lead to 100 deaths), we get a 95% interval for the IFR of [0.3%, 1.1%]. This agrees with other research I’ve seen, unlike the paper’s results, which I believe were 0.1%-0.2%.
When I say “measured infections” I mean “the infections that would result from extrapolating the prevalence estimated using statistical methods over the population of Santa Clara County”.